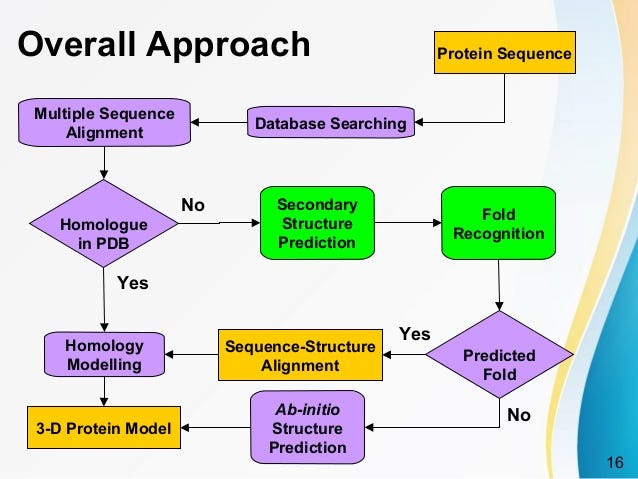
Protein Structure Modelling
Prediction of the three dimensional structure of a target protein from the amino acid sequence of a homologous (template) protein for which an X-ray or NMR structure is available.
Three approaches to structure prediction:
Ab initio(de novo) prediction
- Predict the 3D structure from “first principles”, based on energetic or statistical principles. It cost large computational power and time.
ex.QUARK(https://omictools.com/quark-tool)
-A computer algorithm for ab initio protein folding and protein structure prediction, which aims to construct the correct protein 3D model from amino acid sequence only.
-QUARK models are built from small fragments (1-20 residues long) by replica-exchange Monte Carlo simulation under the guide of an atomic-level knowledge-based force field.
TM-score: >0.5 reliable
<0.17 not reliable
- Predict the 3D structure from “first principles”, based on energetic or statistical principles. It cost large computational power and time.
Sequence- Structure Threading
- Given the sequence, and a set of folds observed in PDB, see if any of the sequences could adopt one the known folds.
ex.I-TASSER(https://zhanglab.ccmb.med.umich.edu/I-TASSER/)
I-TASSER (Iterative Threading ASSEmbly Refinement) is a hierarchical approach to protein structure and function prediction. - It first identifies structural templates from the PDB by multiple threading approach LOMETS, with full-length atomic models constructed by iterative template-based fragment assembly simulations.
Other tools:RaptorX,FoldX
C-score:[-5,2],the higher the better.
- Given the sequence, and a set of folds observed in PDB, see if any of the sequences could adopt one the known folds.
Homology Modelling
If two proteins are homologous (which can be assumed with 50% similarity), then in almost all cases they will have similar folds.
You only use this method when a given sequence with homology (> 30%) to a known structure as template to create a 3D model from the sequence.
BLAST finds regions of similarity between biological sequences.Schrodinger Prime:”Building Homology Models with Prime: A Case Study with Factor Xa Workshop Tutorial”.
Modeller:Python script open software source
Swiss Model: Homology Modelling Of Superoxide Dismutase [Cu-Zn]: Step by step example on how to build a homology model using SWISS-MODEL(Qmean4:[0,1],higher the better)
How homology modeling works?
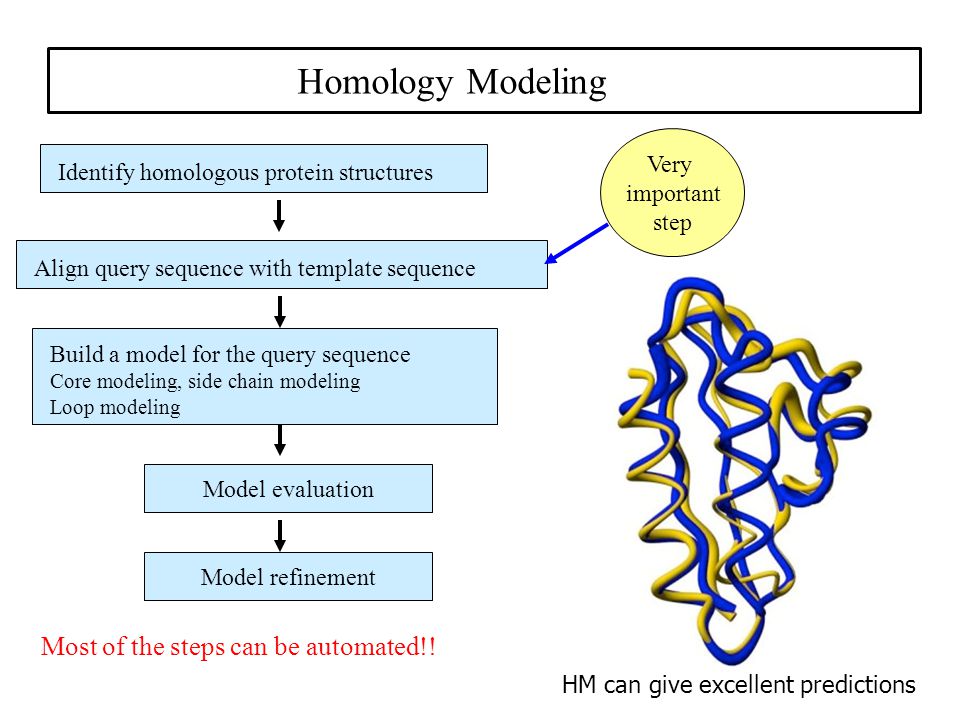
Target-Template Sequence Alignment
Absolutely Critical:
– Sequence alignment is the bottleneck of the modeling process
– No comparative modeling scheme can recover from an incorrect alignment.
How does one find template(s)?
The simplest template determination approaches use fairly common database searching methods (i.e., BLAST and FASTA).
In slightly more difficult cases, multiple sequence alignment and profile-based methods might be used to identify and better align the template to the target sequence.
When multiple targets are identified, there are a variety of ways of determining the best — this is a very important step.
Key factors to consider include:
coverage,
sequence similarity/phylogenetic clustering,
matching of target predicted secondary structure with observed template secondary structure,
structure quality (resolution, R-factor, etc.),
known functional relationships, etc.
Backbone Model Generation
For most of the model, creating the backbone structure with traditional homology modeling protocol is trivial (simply copy the coordinates from one to template to the model!). If there is a match within the alignment, the coordinates of the sidechain can be copied as well.
More recent methods attempt to use multiple structural templates (e.g. if one template has good overlap in one area, while the other has better overlap elsewhere).
The program SEGMOD builds the model structure using a hexapeptide fragment library. The model structure is built based on a series of these fragments.
The widely used program MODELER generates a series of distance constraints from the template structure, and then build a model using these restraints in much the same way that is done with NMR structure determination.
One of the advantages of using satisfaction of spatial restraints method is that it can incorporate various restraints from experiments, such as NMR experiments, site-directed mutagenesis and cross-linking experiments.
Loop Modeling
Modeling loops that lack coverage within the template is extremely difficult, yet common due to:
Template structure is not well resolved.
Sequence divergence.
Insertions/Deletions
To make things worse, loop regions vary significantly between model and template even when complete coverage is present.
Surface loops tend to be involved in crystal contacts, leading to significant conformational changes dependent upon the unit cell.
The exchange of a small to bulky sidechain underneath the loop (within the core) can “push” it aside.
Also, remember that loop regions are generally floppy and fluctuate constantly, meaning a fixed conformation may have little biological meaning.
20 Loop Modeling Methods Knowledge-based: Energy-based:
Find matching loops with the right number of residues and matching endpoints within the PDB.
In particularly difficult cases (loops longer than ~8 residues), chain fragments together. Based on the premise that irregular substructures are built from combinations of Small Standard Structures.
Energy-based:
Generate random loops of right length and endpoints. Evaluate resultant structure with some sort of energy function.
Side-chain Modeling/Packing
Some sort of knowledge-based rotamer library from high-resolution structures is used.
Combinatorial explosion:
Intuitively, it makes sense that the conformation of one will affect the conformations of others.
Fortunately, rotamer space is not limitless.
Assuming, fiver rotamers per residue, there is still 5100 different combinations to score within a 100 amino acid protein.
Solutions:
Certain backbone conformations strongly favor certain rotamers, meaning the others can be ignored.
More rigid residues can be modeled first, and the more flexible (larger rotamer space) can be modeled subsequently. The advantage of this is that the more rigid residue limits the space that must be explored by the flexible one.
Nature picks rotamer conformations that maximize packing (minimize voids) and the number of interactions with other groups (i.e. H-bonds, salt bridges, disulfide bonds, etc.).
Model Optimization
Sometimes the rotamers are predicted based on incorrect backbone or incorrect prediction. Such cases modeling programs either restrain the atom positions and/or apply only a few hundred steps of energy minimization to get an accurate value. This accuracy can be achieved by 2 ways.
- Quantum force field: To handle large molecules efficiently force field can be used, energies are therefore normally expressed as a function of the positions of the atomic nuclei only. Van der Waals forces are, for example, so difficult to treat, that they must often be completely omitted. While providing more accurate electrostatics, the overall precision achieved is still about the same as in the classical force fields.
- Self-parametrizing force fields: The precision of a force field depends to a large extent on its parameters (e.g., Van der Waals radii, atomic charges). These parameters are usually obtained from quantum chemical calculations on small molecules and fitting to experimental data, following elaborate rules (Wang, Cieplak, and Kollman, 2000). By applying the force field to proteins, one implicitly assumes that a peptide chain is just the sum of its individual small molecule building blocks—the amino acids. To increase the precision of the force field, the following steps can be used. Take initial parameters (for example, from an existing force field), change a parameter randomly, energy minimize models, see if the result improved, keep the new force field if yes, otherwise go back to the previous force field.
The models we obtain may contain errors. These errors mainly depend upon two values.
- The percentage identity between the template and the target.
If the value is > 90% then accuracy can be compared to crystallography, except for a few individual side chains. If its value ranges between 50-90 % r.m.s.d. error can be as large as 1.5 Å, with considerably more errors. If the value is <25% the alignment turns out to be difficult for homology modeling, often leading to quite larger errors.
- The number of errors in the template.
Errors in a model become less of a problem if they can be localized. Therefore, an essential step in the homology modeling process is the verification of the model. The errors can be estimated by calculating the model’s energy based on a force field. This method checks to see if the bond lengths and angles are in a normal range. However, this method cannot judge if the model is correctly folded. The 3D distribution functions can also easily identify misfolded proteins and are good indicators of local model building problems
Automatic modelling – Swiss Model
- Modelling → myWorkspace (Start a new modelling project.)
- You can either paste the protein sequence or provide the UniprotKB AC (P61851) of your target sequence in the input form.
- Click “Search for Templates”
- Template Results
- A checkbox to select and visualise the template in the 3D panel
- The SMTL ID of the template and a link to the SWISS-MODEL Template Library page associated to that SMTL entry
- The protein name of the template
- The GMQE (Global Model Quality Estimation)
- The QSQE (Quaternary Structure Quality Estimation)
- The target–template sequence identity
- A clickable icon to expand the box with the description of the template
Typically, due to their higher variability in terms of sequence and structure compared to the rest of the protein, loops are the regions that are the most susceptible to modelling errors.
On the other hand, they are often involved in protein function, hence accurately modelling their structure is of crucial importance.
Are these loops important for the function of the protein?
- As expected, the regions that show most of the structural differences correspond to positions in the alignment where amino acid substitutitons and indels are present.
Even if these differences seem to have little or no impact on the overall structure of the protein, they can still play an important role for the function of the protein, i.e. ligand- and/or substrate-binding.
After you have selected the template(s), click the ‘Build Model’ button to run the modelling job.
Compared to the sequence of the target, they show some insertions and deletions as well as some amino acid substitution.
By clicking on the cog icon, you can change the colouring scheme of the alignement by selecting one of the many available options. Let’s select the Clustal colouring scheme.
Model assessment
(Swiss model:https://swissmodel.expasy.org/assess/help)
SAVES server (http://nihserver.mbi.ucla.edu/SAVES/) from NIH MBI Laboratory is mostly useful for analysis.
This metaserver runs 6 programs(PROCHECK、WHAT_CHECK、ERRAT、VERIFY_3D、PROVE、CRYST1) for checking and validating protein structures during and after model refinement.
The Ramachandran plot function in the Model Panel plots the distribution of amino acid backbone conformations in peptide and protein structures.
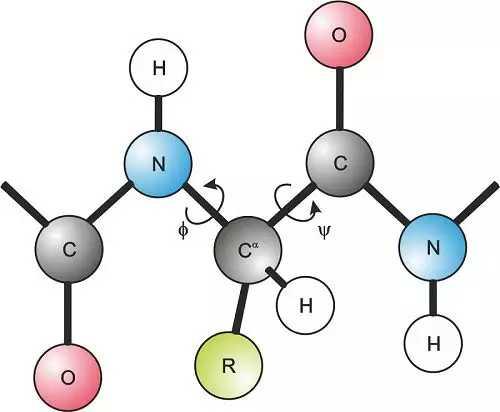
The two torsion angles of the polypeptide chain, also called Ramachandran angles, describe the rotations of the polypeptide backbone around the bonds between N-Cα (called Phi, φ) and Cα-C (called Psi, ψ). The Ramachandran plot provides an easy way to view the distribution of torsion angles of a protein structure. It also provides an overview of allowed and disallowed regions of torsion angle values, serving as an important factor in the assessment of the quality of protein three-dimensional structures.
Q:What to Do with Your Protein Model?
Molecular Interaction Studies – Molecular Docking.
Computer-aided drug discovery.
Improve the results of Quantitative Structure-Activity Relationship (QSAR) techniques.
Sources:
https://medium.com/@HeleneOMICtools/a-guide-for-protein-structure-prediction-methods-and-software-916a2f718cfe
I-TASSER: a unified platform for automated protein structure and function prediction
Predict the structure of protein-Homology Modeling
https://zhuanlan.zhihu.com/p/45041082
https://vlab.amrita.edu/?sub=3&brch=275&sim=1481&cnt=1
https://en.m.wikibooks.org/wiki/Structural_Biochemistry/Proteins/Ramachandran_Plot